

Subscribe to RSS
DOI: 10.1055/s-0042-116684
Radiation Dose Monitoring in the Clinical Routine
Strahlendosismonitoring in der klinischen RoutineAuthors
Correspondence
Publication History
29 December 2015
28 August 2016
Publication Date:
15 November 2016 (online)

Abstract
Here we describe the first clinical experiences regarding the use of an automated radiation dose management software to monitor the radiation dose of patients during routine examinations. Many software solutions for monitoring radiation dose have emerged in the last decade. The continuous progress in radiological techniques, new scan features, scanner generations and protocols are the primary challenge for radiation dose monitoring software systems. To simulate valid dose calculations, radiation dose monitoring systems have to follow current trends and stay constantly up-to-date. The dose management software is connected to all devices at our institute and conducts automatic data acquisition and radiation dose calculation. The system incorporates 18 virtual phantoms based on the Cristy phantom family, estimating doses in newborns to adults. Dose calculation relies on a Monte Carlo simulation engine. Our first practical experiences demonstrate that the software is capable of dose estimation in the clinical routine. Its implementation and use have some limitations that can be overcome. The software is promising and allows assessment of radiation doses, like organ and effective doses according to ICRP 60 and ICRP 103, patient radiation dose history and cumulative radiation doses. Furthermore, we are able to determine local diagnostic reference doses. The radiation dose monitoring software systems can facilitate networking between hospitals and radiological departments, thus refining radiation doses and implementing reference doses at substantially lower levels.
Zusammenfassung
Wir berichten über die ersten, klinischen Erfahrungen mit einer Dosis Monitoring Software zur automatischen Erfassung der Strahlendosis in der alltäglichen Routine. In den letzten Jahrzehnten wurden einige Software-Produkte zur Erfassung der Strahlenexposition entwickelt. Der kontinuierliche, technische Fortschritt in der Radiologie, neue Scantechniken, Gerätegenerationen und CT-Protokolle stellen eine der größten Herausforderungen bei deren Entwicklung dar. Für eine valide Simulation der Strahlendosis müssen Dosis-Monitoring-Software-Produkte dem Trend in der Radiologie folgen, um auf dem aktuellen Stand zu bleiben. Die evaluierte Dosis Monitoring Software ist mit allen Geräten an unserem Institut verbunden und führt eine automatische Datenerfassung und Berechnung der Strahlendosis durch. Die Software umfasst eine Bibliothek von insgesamt 18 virtuellen Phantomen basierend auf der Cristy Phantomfamilie, und kann so die Strahlendosis vom Neugeborenen bis zum Erwachsenen simulieren. Die Dosisberechnung beruht auf Monte-Carlo-Simulationen. Unsere ersten, praktischen Erfahrungen zeigen, dass die Software in der Lage ist die Strahlendosis in der klinischen Routine zuverlässig zu erfassen. Die Implementierung und Anwendung weisen einige Limitationen auf, die überwunden werden können. Die Software ermöglicht es die Strahlendosis einer Untersuchung, die Organ- und die effektive Dosis (nach ICRP 60 und ICRP 103), die Patientendosis Historie und die kumulative Strahlendosis zu simulieren und zu dokumentieren. Darüber hinaus ist es möglich die Lokalen Diagnostischen Referenzlevels zu ermitteln. Die Zusammenarbeit und Vernetzung zwischen medizinischen Zentren und radiologischen Instituten ist notwendig, um die diagnostische Referenzwerte auf einem signifikant niedrigeren Niveau zu etablieren.
Introduction
The European Directive on Medical Exposures 97/43/Euratom emphasizes the radiologist’s responsibility to use appropriate radiologic equipment and to implement quality control measures to assess patient doses and to prevent high-dose exposures (Articles 9 and 11). It underlines the importance of collecting and analyzing radiation doses of performed examinations. Three methods to estimate effective doses, each of which has its limitations, are currently applicable: computer-based mathematical simulations (Monte Carlo), thermoluminescence dosimeters, and estimation using conversion factors (determined in model calculations) from the dose length product (DLP). In summer 2013 the dose management software Radimetrics Enterprise Platform version 2.5 (Bayer Healthcare, Leverkusen, Germany) was installed at our institute. The dose calculation relies on a Monte-Carlo simulation engine. Here we report on the first practical experiences with this radiation dose management software in the clinical routine, its implementation at a large multicenter institute, future implications and possible developments.
Motivation and background
The abovementioned radiation dose monitoring software was installed in order to be able to continuously assess the radiation dose of individual examinations performed at our institute. Another aim was to examine our local diagnostic reference levels (LDRL). Diagnostic reference levels were used for the first time in 1989 for managing patient dose in the United Kingdom. Since then they have proven to be an effective tool for dose audit, helping to reduce unnecessary radiation exposure (Shrimpton PC et al. NRPB-W67; 2005). The achievable dose is an additional benchmark for optimization (NCRP Report No. 172; 2012), in particular for facilities at which the DRL is not exceeded. In Germany, diagnostic reference levels are established for X-ray and nuclear medicine examinations by the Federal Office for Radiation Protection (BfS) on the basis of a national survey performed in 1999.
Every CT examination involves a visible output (topogram, image slices of well-defined scan region, diagnostic image quality etc.) and an invisible input (kV, mAs etc.). The DICOM header delivers detailed information about the latter. These data along with thorough knowledge of conversion factors may give a rough approximation of radiation doses. Radiation dose quantities (i. e., cumulative exposure time, dose area product, peak skin dose, etc.) are not uniformly used and are therefore difficult to interpret and compare with respect to radiation harm. A more sophisticated method for estimating the detriment of radiation exposure is based on the effective dose and the organ dose. The effective dose and the organ dose can be assessed with thermoluminescence dosimeters and phantom measurements. However, dose measurements with thermoluminescence dosimeters are not practicable during the clinical routine and require many resources. Another means of assessing effective dose and organ dose is provided by radiation dose management systems. The Radimetrics Enterprise Platform works automatically, estimating radiation doses with Monte-Carlo simulations for all examinations by retrieving data directly from connected devices, thus avoiding the manual transfer of parameters in a prescribed form.
Implementation at our institute
The RIS/PACS system and all devices at our institute dealing with X-rays were connected with the dose monitoring software: four monoplanar and two biplanar angiography systems, seven CT scanners (three with high pitch imaging technique), two SPECT/CT scanners and two PET/CT scanners. Imaging protocols were then filtered and mapped to the software master protocol. This procedure is always required when a new device or a new device protocol needs to be installed. It ensures that all data are automatically sent to the monitoring software from the institutional PACS system. Scan parameters are read from various sources like radiation dose structured reports (RDSR), dose sheet and DICOM tags. Altogether, we defined 7 master protocols for the head, neck, spine, heart, thorax and abdomen as well as for combined examinations of the thorax and abdomen. In the further course of the software installation, systematic selection of basic protocols was performed.
The software’s phantom library includes 18 different virtual phantoms, e. g. bariatric phantoms, all based on the Cristy family of phantoms. Several determinants define which virtual phantom is to be chosen for an individual patient: age, gender, weight, effective diameter and water equivalent diameter (WED). This selection of phantoms makes an approximation of radiation doses as close to real irradiation conditions as possible. For that purpose, it was necessary to add some additional variables to our anamnesis prior to patient examination. The details of the calculation are provided in the white papers (Radiation Dose Calculations in Radimetrics Enterprise Platform by Bayer; RAD-INF-13 – 05 968 March 2014; https://www.radiologie.bayer.de/informatics/radimetrics-ep Accessed 15 June 2016).
Monitoring components and their utilization in the clinical routine
In order to achieve transparent supervision of radiation doses, a trained monitoring team was established: three residents and three attending physicians who were responsible for tracking and analyzing radiation doses; three medical radiation technologists who were responsible for the optimization of procedures, and two information scientists who were responsible for the implementation of the software, for technical questions and for connection to new devices. The training was conducted in several sessions at our university hospital. The monitoring software combines three basic features: calculation, simulation and monitoring of radiation doses. A systematic analysis was performed and data was filtered according to a range of variables: study description, date, gender, age, modality (CT, PET/CT etc.), device, site (three hospitals are affiliated our institute), effective dose, etc. Radiation doses of interest can be visualized in numerous ways, e. g. value frequency distribution, clustered bar or pie chart, dose by anatomy, scatter plot distribution, detailed value analysis table, etc. ([Fig. 1], [2], [3]). Clicking on a bar within a bar chart opens a small pop-up window displaying the individual preset values of interest (e. g. maximum, minimum or mean value). Double-clicking displays the whole table of examinations with values sorted according to different variables (protocol name, DAP, effective dose, etc.). For an accurate dose calculation, it is essential to be acquainted with the limits of automatic localizer mapping. The dose monitoring software can use two different ways of mapping the scan region to the virtual phantoms, either the scan region description or image registration. Therefore, study descriptions of CT examinations have to be harmonized and standardized to a large extent. Furthermore, it is necessary to consider protocol-specific influences, e. g. the impact of gantry angulation and “in-plane current modulation”, which are routinely used in the majority of our examinations, but unfortunately are not included in the simulation ([Fig. 2]).
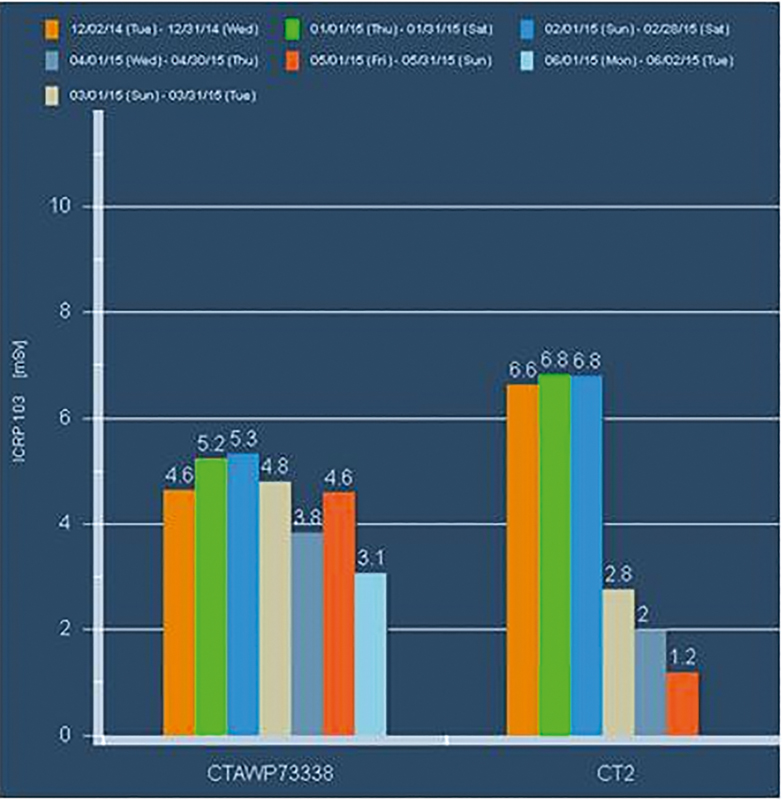
Abb. 1 Effektive Dosis (in mSv) von CT-Untersuchungen für ein Thorax Protokoll an demselben CT-Scanner-Typ an zwei unterschiedlichen Standorten ermittelt von der Dosis Monitoring Software (von 12.2014 – 06.2015). Die Strahlendosisreduktion wurde u. a. durch eine Harmonisierung sowie Reduzierung der Vielzahl der unterschiedlichen Protokolle und die Einführung des iterativen Rekonstruktionsverfahrens ADMIRE erreicht.

Abb. 2 Exemplarische Darstellung der Strahlendosis einer routinemäßigen CT-Thorax-Untersuchung einer 28-jährigen Frau am Somatom Force (Siemens Healthcare, Deutschland). X-CARE adaptiert den Röhrenstrom automatisch oberhalb strahlensensibler Organe. Aktuell wird die anguläre Dosismodulation nicht in dem DICOM Header wiedergegeben. Dennoch wird der Einfluss von X-CARE indirekt in der Simulation berücksichtigt. Die kalkulierte Strahlendosis wird anhand des CTDIvol pro Schicht normalisiert. Der durchschnittliche Röhrenstrom und CTDIvol per Schicht ändern sich, woraus eine entsprechend anders kalkulierte Strahlendosis resultiert.

Abb. 3 Altersverteilung von Patienten (in %), welche eine hohe kumulative Dosis aufgrund wiederholter Nachsorgeuntersuchungen im Zeitraum von 02/2014 – 02/2015 erhielten.
For determination of the local diagnostic reference levels, the mean CT dose index (CTDIvol) and dose length product (DLP) of all examinations are assessed, provided by a specific master protocol (unenhanced cranial CT protocol, CT thorax and CT abdomen) and scanner. As recommended by the ICRP, the diagnostic reference level is set to the 75th percentile of the dose distribution. The achievable dose is set to the 50th percentile of the dose distribution ([Table 1], [2], [3]). These practical dose quantities do not directly reflect the risk to individuals, such as effective dose or organ dose. However, in contrast to other dose quantities, which may be subject to great variability, these dose indicators allow a more reproducible comparison of radiation exposure in the clinical routine. CTDIvol and DLP are specified in standard CT dosimetry phantoms (16 cm diameter for cranial protocols; 32 cm diameter for body protocols).
|
2014 |
2015 |
|
|
CTDIvol |
50th |
|
|
CT thorax DLP-32[1] |
8.3 |
4.2 |
|
CT abdomen DLP-321 |
12.3 |
6.3 |
|
DLP |
50th |
|
|
CT thorax DLP-321 |
297 |
179 |
|
CT abdomen DLP-321 |
830 |
334 |
1 Referring to standard dosimetry phantom with a diameter of 32cm for body.
1 Referring to standard dosimetry phantom with a diameter of 32cm for the body.
1 Referring to standard dosimetry phantom with a diameter of 32 cm for body.
With the help of the dose monitoring software, the CTDIvol and DLPs of all examinations were continuously recorded. Measures to adapt protocols for the harmonization of radiation doses at a lower level were taken. The histogram in [Fig. 1] depicts an example of the decrease in radiation doses in standard CT thorax examinations for a single CT protocol on two different CT scanners at our institute within one year.
A feature of the dose monitoring software is a protocol-specific dose alert threshold. Initially, special thresholds for DLP, CTDIvol, effective dose, eye-lens dose and cumulative dose were defined. Each time a defined threshold is exceeded, the system generates an alert. On a weekly basis we make a report of all alerts and discuss the reasons for dose exceedance. To date, there is no general directive regarding cumulative doses. Hence, we defined an internal institute threshold for cumulative doses, which is approximately sevenfold higher than the diagnostic reference level for a single CT examination published by the Federal Office for Radiation Protection, Neuherberg, Germany, in 2010 (e. g. head: DLP 300 mGy*cm for newborns; head: DLP 950 mGy*cm for adults; thorax: DLP 400 mGy*cm for adults; abdomen: DLP 900 mGy*cm for adults, etc.). The number of examinations necessary to exceed the cumulative dose is highly dependent on the kind of CT examination that is performed, e. g., unenhanced, cranial CT, CT of the vessels, multiphase CT, etc.
The histogram in [Fig. 3] reflects the age distribution of patients who were exposed to higher cumulative doses within a year. As the figure demonstrates, a certain percentage of younger patients in the age group of 20 – 30 years received higher cumulative doses. We suppose that one of the reasons for a peak in this young age group reflects the fact that a large hemato-oncological center and center of sarcomas are part of the main site, the university hospital. In the clinical routine, we try to scan all patients under 30 on our newest CT scanner in order to minimize radiation dose.
Dose alerts primarily appear in patients who received frequent oncological staging CT examinations for follow-up. Another common reason for alerts was examinations performed on the institute’s “oldest” CT scanners, Somatom Volume Zoom and Somatom Emotion 6, which were significantly higher than on the other multislice CT scanners, SOMATOM Definition AS+, Flash and SOMATOM Force (Siemens, Germany). This leaves 10 % of alerts which need to be traced back: they involve examinations including several scanning phases, extensive CT scan fields from head to toe, patient-related reasons (e. g. body habitus), etc.
In the clinical routine, radiologists are frequently faced with specific anxieties about the risks of radiation exposure. Radiation dose management programs make it possible to predict the projected dose of a scheduled examination in advance and thus might mitigate both patient and physician concerns. The estimation is generated using a mean value from previously performed examinations with the same requested protocol.
As in the case of every server, memory capacity is not unlimited. Automatic deletion of examination records might be a solution to this problem. In order to obtain data again, we must manually collect the examination record of interest from the RIS/PACS system and send it.
Summary and future implications
Today the monitoring of radiation doses has become a quality criterion of radiological examinations (Miller et. al. Quality Improvement Guidelines for Recording Patient Radiation Dose in the Medical Record. J Vasc Interv Radiology 2004; 15: 423 – 429). The recording of radiation doses contributes to patient safety. Concerns have been raised especially regarding the fact that wide variations in radiation dose have been observed for the same type of examinations between different institutions. This great variability in radiation dose indicates the need for standardization. Moreover, it underlines the necessity for better quality assurance. Feedback regarding radiation doses may raise awareness of this important issue to the operator himself and allow conscious training (Hawthorne effect). In cooperation with the Federal Office for Radiation Protection (Neuherberg, Germany), we verified radiation doses estimated by the monitoring software with the reference standard of dose measurements, phantom measurements with TLD-s (LiF:Mg,Ti). Our results showed that there was a good correlation of radiation doses estimated by the monitoring software and measured with TLD-s (Guberina et al. Clinical evaluation of a dose monitoring software tool based on Monte Carlo Simulation in assessment of eye lens doses for cranial CT scans. Neuroradiology 2016; DOI: 10.1007/s00234-016-1722-x). Our first practical experiences demonstrate that the monitoring software is capable of dose estimation in the clinical routine. The monitoring software is promising because it allows more accurate assessment of individual and cumulative radiation doses. Since the implementation of the monitoring software in our institute, several studies have been initiated in order to identify determinants of a lower radiation level and ways of achieving this: epidemiological analysis of radiation doses of special patient cohorts (e. g. children, multiple trauma patients, etc.), development of radiation doses in the past decade depending on the CT scanner generation, impact of special CT protocol features (table height, a. p. localizer vs. lateral localizer, pitch factor, etc.) and optimization of CT protocols. However, the software does not replace the radiologist’s responsibility to be familiar with protocol and device-specific influences on radiation exposure and to perform reliable and intelligent dose tracking in the clinical routine. A network between different institutions and radiological departments is desirable as it might play an essential role in radiation health protection in order to implement a national database of radiation doses. The network should and must also include medical physics experts as a stated in the EURATOM Basic Safety Standards directive. The regular review of local diagnostic reference levels provides a feedback loop which can enhance and accelerate the refinement and harmonization of radiation doses to a substantially lower level nationwide.
No conflict of interest has been declared by the author(s).
Correspondence
Abb. 1 Effektive Dosis (in mSv) von CT-Untersuchungen für ein Thorax Protokoll an demselben CT-Scanner-Typ an zwei unterschiedlichen Standorten ermittelt von der Dosis Monitoring Software (von 12.2014 – 06.2015). Die Strahlendosisreduktion wurde u. a. durch eine Harmonisierung sowie Reduzierung der Vielzahl der unterschiedlichen Protokolle und die Einführung des iterativen Rekonstruktionsverfahrens ADMIRE erreicht.
Abb. 2 Exemplarische Darstellung der Strahlendosis einer routinemäßigen CT-Thorax-Untersuchung einer 28-jährigen Frau am Somatom Force (Siemens Healthcare, Deutschland). X-CARE adaptiert den Röhrenstrom automatisch oberhalb strahlensensibler Organe. Aktuell wird die anguläre Dosismodulation nicht in dem DICOM Header wiedergegeben. Dennoch wird der Einfluss von X-CARE indirekt in der Simulation berücksichtigt. Die kalkulierte Strahlendosis wird anhand des CTDIvol pro Schicht normalisiert. Der durchschnittliche Röhrenstrom und CTDIvol per Schicht ändern sich, woraus eine entsprechend anders kalkulierte Strahlendosis resultiert.
Abb. 3 Altersverteilung von Patienten (in %), welche eine hohe kumulative Dosis aufgrund wiederholter Nachsorgeuntersuchungen im Zeitraum von 02/2014 – 02/2015 erhielten.