
Subscribe to RSS
DOI: 10.1055/s-0042-115572
Discrimination of Different Brain Metastases and Primary CNS Lymphomas Using Morphologic Criteria and Diffusion Tensor Imaging
Unterscheidung verschiedener Hirnmetastasen und primärer ZNS-Lymphome anhand morphologischer Kriterien und Diffusions-Tensor-BildgebungCorrespondence
Publication History
17 June 2016
13 August 2016
Publication Date:
19 September 2016 (online)

Abstract
Purpose: Brain metastases are a common complication of cancer and occur in about 15 – 40 % of patients with malignancies. The aim of this retrospective study was to differentiate between metastases from different primary tumors/CNS lymphyomas using morphologic criteria, fractional anisotropy (FA) and apparent diffusion coefficient (ADC).
Materials and Methods: Morphologic criteria such as hemorrhage, cysts, pattern of contrast enhancement and location were reported in 200 consecutive patients with brain metastases/primary CNS lymphomas. FA and ADC values were measured in regions of interest (ROIs) placed in the contrast-enhancing tumor part, the necrosis and the non-enhancing peritumoral region (NEPTR). Differences between histopathological subtypes of metastases were analyzed using non-parametric tests, decision trees and hierarchical clustering analysis.
Results: Significant differences were found in morphologic criteria such as hemorrhage or pattern of contrast enhancement. In diffusion measurements, significant differences between the different tumor entities were only found in ADC analyzed in the contrast-enhancing tumor part. Among single tumor entities, primary CNS lymphomas showed significantly lower median ADC values in the contrast-enhancing tumor part (ADClymphoma 0.92 [0.83 – 1.07] vs. ADCno_lymphoma 1.35 [1.10 – 1.64] P = 0.001). Further differentiation between types of metastases was not possible using FA and ADC.
Conclusion: There were morphologic differences among the main subtypes of brain metastases/CNS lymphomas. However, due to a high variability of common types of metastases and low specificity, prospective differentiation remained challenging. DTI including FA and ADC was not a reliable tool for differentiation between different histopathological subtypes of brain metastases except for CNS lymphomas showing lower ADC values. Biopsy, surgery and staging remain essential for diagnosis.
Key Points:
• Histopathological subtypes of brain metastases/CNS lymphomas show different morphologic features on MRI
• Primary CNS lymphomas show significantly reduced ADC values
• DTI is not a reliable tool for differentiation between brain metastases
Citation Format:
• Bette S, Wiestler B, Delbridge C et al. Discrimination of Different Brain Metastases and Primary CNS Lymphomas Using Morphologic Criteria and Diffusion Tensor Imaging. Fortschr Röntgenstr 2016; 188: 1134 – 1143
#
Zusammenfassung
Ziel: Hirnmetastasen treten in ca. 15 – 40 % der Patienten mit malignen Grunderkrankungen auf. Ziel dieser Studie war es, zwischen Hirnmetastasen unterschiedlicher Primärtumore/ZNS-Lymphomen bildgebend anhand morphologischer Kriterien sowie der Fraktionalen Anisotropie (FA) und dem „apparent diffusion coefficient“ (ADC) der Diffusions-Tensor-Bildgebung (DTI) zu differenzieren.
Material und Methoden: 200 Patienten mit zerebralen Hirnmetastasen/primären ZNS-Lymphomen wurden retrospektiv eingeschlossen. Morphologische Kriterien wie Blutung, Zysten, Art der Kontrastmittelanreicherung sowie Lokalisation wurden untersucht. Die FA- und ADC-Werte wurden mithilfe von regions of interest (ROIs) im Kontrastmittelanreichernden Tumoranteil, der Nekrose sowie der peritumoralen Region untersucht. Unterschiede wurde anhand von nicht-parametrischen Tests, Entscheidungsbäumen sowie Clusteranalysen statistisch analysiert.
Ergebnisse: Signifikante Unterschiede zwischen den Hirnmetastasen verschiedener Primärtumoren zeigten sich bei den morphologischen Kriterien wie Blutung und Art der Kontrastmittelanreicherung. Zudem zeigten sich signifikante Unterschiede für die ADC-Werte im Kontrastmittelanreichernden Tumoranteil. Primäre ZNS-Lymphome zeigten signifikant niedrigere mediane ADC-Werte im Kontrastmittelanreichernden Tumoranteil (ADClymphom 0,92 [0,83 – 1,07] vs ADCkein_lymphom 1,35 [1,10 – 1,64] P = 0,001). Eine weitere Differenzierung anhand von FA- und ADC-Werten war nicht möglich.
Schlussfolgerung: Hirnmetastasen unterschiedlicher Primärtumoren/primärer ZNS-Lymphome unterscheiden sich hinsichtlich morphologischer Kriterien. Jedoch zeigt sich aufgrund der hohen Variabilität eine niedrige Spezifität. Anhand von FA und ADC ist keine verlässliche Differenzierung unterschiedlicher Hirnmetastasen möglich mit Ausnahme von ZNS-Lymphomen, die niedrigere ADC-Werte zeigen. Somit bleiben die Operation, Biopsie oder das Staging weiterhin notwendig für die Diagnosestellung.
Kernaussagen:
• Histopathologische Subtypen von Hirnmetastasen/ZNS-Lymphomen unterscheiden sich hinsichtlich der Morphologie im MRT
• Primäre ZNS-Lymphome zeigen signifikant niedrigere ADC-Werte
• DTI kann nicht zwischen Subtypen von Hirnmetastasen differenzieren
#
Key words
brain metastases - diffusion tensor imaging - fractional anisotropy - apparent diffusion coefficientIntroduction
Brain metastases are a common complication of many types of cancer. They have a higher incidence compared to gliomas [1] [2]. In some patients with malignancies, brain metastases may even be the first clinical manifestation. Malignancies like breast, lung, renal, gastrointestinal or skin cancer are known to frequently develop brain metastases [2]. However, brain metastases also occur in other types of cancer such as thymoma [3], hepatocellular cancer [4] and endometrial carcinoma [5]. MRI is the gold standard for the diagnosis of brain metastases, either for screening in asymptomatic patients or assessment of neurological symptoms of patients with known malignancies [1] [2]. Essential sequences are T2-weighted fluid-attenuated inversion recovery (FLAIR) images to detect the extent of the edema, T1-weighted (w) images without contrast agent to detect hemorrhage and T1w images after the application of contrast agent to analyze the disruption of the blood-brain barrier [1]. Morphologic criteria were evaluated to differentiate brain metastases, but the determination of the primary cancer remains challenging due to the high variability of MR signal changes [1]. Diffusion-weighted images (DWI) gained a more important role in the diagnosis of brain metastases. It was shown that apparent diffusion coefficient (ADC) values are important to differentiate between high-grade gliomas and brain metastases [6] [7]. Lymphomas have lower ADC values than high-grade gliomas [8]. Another study pointed out that diffusion-weighted imaging may aid in differentiating between histopathological types of brain metastases [9]. Diffusion tensor imaging (DTI) is important for the preoperative planning of neurosurgical intervention [10] and fractional anisotropy (FA) may help to differentiate between brain tumors and metastases [11]. As therapy strategies differ between different subtypes of brain metastases (e. g. small or non-small cell lung cancer), the diagnosis of the histopathological subtype before surgery/biopsy would be of great interest.
The aim of this study was to differentiate between histopathological types of brain metastases/primary CNS lymphomas using ADC and FA values of diffusion tensor imaging in conjunction with morphologic criteria.
#
Methods
Patient population
For this retrospectively designed single center study, 200 consecutive patients with brain metastases and primary CNS lymphomas (102 m/98f), treated between February 2009 and December 2015, were analyzed. The inclusion criteria were preoperative diffusion-weighted imaging (diffusion tensor imaging or diffusion-weighted imaging), biopsy or surgery of the brain metastases with histopathological diagnosis (n = 191) or a histopathologically proven primary tumor (n = 9). Histopathological subtypes of brain metastases were classified with respect to the location of the primary tumor (e. g. lung) as well as histopathological features (e. g. squamous cell carcinoma, adenocarcinoma).
The study was approved by the local ethics committee (5626/12) in accordance with the ethical standards of the 1964 Declaration of Helsinki and its later amendments [12].
#
Magnetic resonance imaging
MRI was performed at 3 Tesla (T) on a Philips Achieva (Achieva 3 T, Philips Medical Systems, The Netherlands B.V.), Siemens Verio (Siemens Healthcare, MAGNETOM VERIO 3 T, Erlangen, Germany) or Philips Ingenia (Philips Medical Systems, The Netherlands B.V.).
All patients underwent preoperative T2-weighted FLAIR imaging (2 D or 3 D sequences) and T1w sequences with and without contrast agent (T1-fast field echo (FFE) or magnetization prepared rapid gradient echo (MPRage)). Most patients also underwent T2-weighted gradient echo imaging ([Table 1]). 162 lesions were measured in preoperative diffusion tensor imaging including both FA and ADC, while 38 lesions were measured in diffusion-weighted imaging including ADC. In 48 patients ADC maps were reconstructed from DTI raw data and ADC values were measured using Iplannet (Iplannet Cranial, Brainlab AG, Feldkirchen). In 13 patients with DTI available measurement of ADC values was not possible due to missing DTI raw data.
TR: repetition time; TE: echo time; TI: time of inversion; IR: inversion recovery, SE: spin echo, w: weighted.
#
Image analysis
Image analysis was conducted by a neuroradiologist (S.B.; 6 years of experience). Using regions of interest (ROIs), FA and ADC were measured in the preoperative MRI. For each lesion, FA and ADC were measured in the contrast-enhancing tumor part (FAcontrast/ADCcontrast), the necrosis (if applicable) (FAnecrosis/ADCnecrosis) and the FLAIR hyperintense non-enhancing peritumoral region (NEPTR) (FANEPTR/ADCNEPTR). In each area (contrast-enhancing tumor part, necrosis, NEPTR) four circular ROIs were measured with a diameter of 5 – 10 mm. The mean value was calculated for each region and divided by the FA/ADC value of the crus posterior of the contralateral internal capsule as described previously [13] to avoid a bias due to measurements on different MRI scanners or with different sequences. ROIs were not placed in hemorrhagic areas. In patients with multiple lesions (n = 92), the lesion with later surgery/biopsy or the lesion with the largest diameter was assessed. FA maps were available in 162/200 lesions, and ADC maps in 187/200 lesions. FAcontrast was measured in 157 patients, FAnecrosis in 112 patients, FANEPTR in 161 patients, ADCcontrast in 183 patients, ADCnecrosis in 131 patients and ADCNEPTR in 186 patients. Due to missing contrast enhancement/missing necrosis or hemorrhage/missing edema, measurement was not possible in some patients.
The number of lesions (singular vs. multiple), the location (supra- vs. infratentorial; right/left hemisphere; frontal/temporal/parietal/occipital lobe/cerebellar/brain stem/ventricle), contact to the dura, the existence of cysts or hemorrhage and the pattern of contrast enhancement (solid/nodular/circular/garland-like/solid+circular/solid+garland-like) were assessed.
#
Statistical analysis
Statistical analysis of this explorative study including descriptive data analysis was performed using IBM SPSS Statistics version 23.0 (SPSS Inc., IBM Corp., Armonk, NY, USA). Non-normally distributed data are shown as median and interquartile range. Metric values (FA/ADC values) were compared using the Kruskal-Wallis Test for all histopathological groups. Furthermore, these values were compared between each entity and the remaining samples (e. g. melanoma vs. no melanoma; lung cancer vs. no lung cancer) using the Mann Whitney U Test. The Youden’s index was calculated in receiver operating characteristics (ROC) analysis to determine the best cut-off point for further calculation of sensitivity and specificity.
Comparison of morphologic criteria between two groups was performed using the chi-squared test. Comparison of all morphological parameters was further done by decision trees, using Chi-square automatic interaction detectors (CHAID). Only morphological parameters were included for decision tree analysis due to missing FA/ADC values in some patients. To detect intrinsic correlations between imaging features and histology, we performed unsupervised hierarchical clustering analysis of complete cases. Because the dataset contained both numerical and categorical variables, we used the function "daisy" and Gower's distance for calculation of dissimilarity matrices from the R cluster package. Furthermore, we performed a principal component analysis (PCA) on ADC and FA values in complete cases [14].
#
#
Results
Histopathological analysis revealed 62 lung cancers (58 non-small cell lung cancers, 4 small-cell lung cancers), 29 melanomas, 26 breast cancers, 21 gastrointestinal cancers (including colon, rectum, sigma, esophagus), 6 sarcomas, 12 primary CNS b-cell lymphomas, 18 urothelial carcinomas (including renal and bladder tumors), 12 germ-cell carcinomas (including ovarian carcinoma and seminoma), 4 endometrial carcinomas and 10 other cancers ([Table 2]).
NOS: not otherwise specified.
The morphologic criteria were analyzed in the different histopathological subgroups ([Fig. 1, ] [Table 3]). There were 108 singular lesions and 92 multiple (≥ 2) intracranial lesions. Cystic components were detected in 66 brain metastases, and 43 brain lesions showed hemorrhage. Contact to the dura was observed in 106 metastases. 3 patients showed no relevant contrast enhancement due to hemorrhage. Most of the brain metastases showed solid contrast enhancement (n = 144) ([Table 4]). The highest percentage of hemorrhage was shown by metastases of melanoma (58.6 %), urothelial carcinoma (27.8 %), and lung cancer (19.4 %). Comparing melanoma to all other brain metastases, this difference was significant (P< 0.001). Using this morphologic parameter a sensitivity/specificity of 58.6 %/84.8 % for the diagnosis of melanoma was achieved with a positive/negative predictive value of 39.5 %/92.4 %, respectively. Metastases of urothelial carcinoma (P = 0.497) and lung cancer (P = 0.386) did not show a significantly higher rate of hemorrhage. The highest fraction of a solid component was observed in metastases of breast cancer (100.0 %), lymphoma (100.0 %) and sarcoma (100.0 %). Comparing breast cancer metastases to all other metastases, this difference remained significant (P = 0.049), resulting in a sensitivity/specificity of 100.0 %/13.2 % and a positive/negative predictive value of 14.7 %/100.0 %, respectively. Contact to the dura was shown mostly by metastases of sarcoma (83.3 %) and gastrointestinal tumors (61.9 %). However, differences compared to other tumor types were not significant (sarcoma: P = 0.131; GI cancer: P = 0.387).

Abb. 1 Die erste Reihe zeigt eine Melanommetastase mit einem hyperintensen Signal in der nativen T1-Sequenz A und einer zirkulären Kontrastmittelanreicherung B. Die zweite Reihe zeigt ein Beispiel einer Nierenzellkarzinommetastase mit einer Einblutung C und einer zirkulären Kontrastmittelanreicherung D. Beispiel einer Metastase eines gastrointestinalen Karzinoms mit einem typischen Kontakt zur Dura E. Typische solide Kontrastmittelanreicherung einer Mammakarzinommetastase F.
GI: gastrointestinal cancer. GI: gastrointestinal.
GI: gastrointestinal cancer. GI: gastrointestinal.
Regarding the median values of measured ratios of fractional anisotropy and apparent diffusion coefficient, the only significant differences between different histopathological subtypes were observed for ADCcontrast using the Kruskal-Wallis Test (P = 0.010) ([Fig. 2]). No significant differences were observed for FAcontrast (P = 0.467), FAnecrosis (P = 0.519), FANEPTR (P = 0.176), ADCnecrosis (P = 0.648) and ADCNEPTR (P = 0.910). [Table 5] shows median values of FA and ADC among different histopathological subtypes.
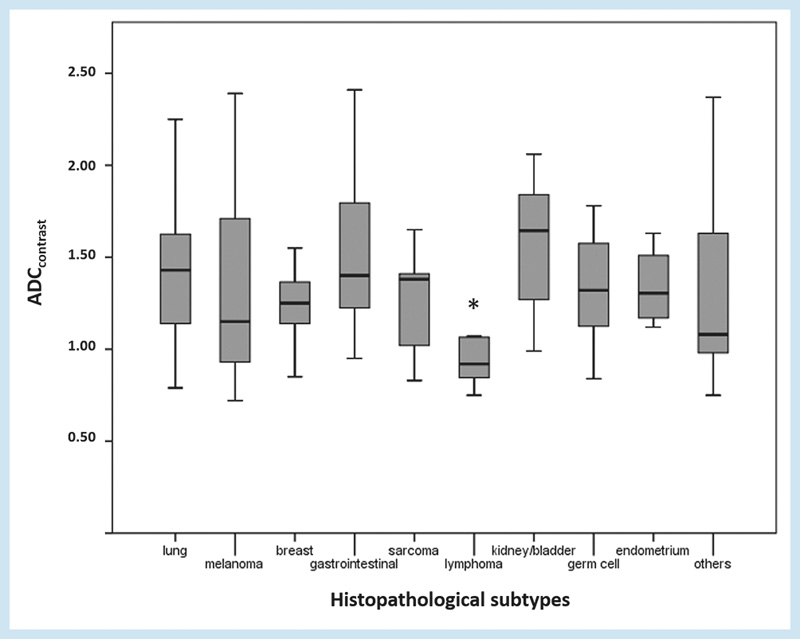
Abb. 2 Werte für ADCcontrast in den unterschiedlichen histopathologischen Subtypen von Hirnmetastasen. * P< 0,05.
|
primary tumor |
FAcontrast |
FAnecrosis |
FANEPTR |
ADCcontrast |
ADCnecrosis |
ADCNEPTR |
|
lung cancer |
0.22 [0.20 – 0.28] |
0.17 [0.12 – 0.21] |
0.23 [0.18 – 0.28] |
1.43 [1.14 – 1.63] |
2.64 [1.48 – 3.48] |
2.15 [1.87 – 2.40] |
|
melanoma |
0.25 [0.19 – 0.28] |
0.20 [0.14 – 0.31] |
0.21 [0.15 – 0.25] |
1.15 [0.92 – 1.76] |
2.41 [1.19 – 3.78] |
2.28 [2.02 – 2.47] |
|
breast cancer |
0.21 [0.16 – 0.26] |
0.18 [0.14 – 0.24] |
0.22 [0.18 – 0.32] |
1.25 [1.14 – 1.38] |
2.56 [2.05 – 3.59] |
2.23 [1.88 – 2.44] |
|
GI cancer |
0.23 [0.18 – 0.27] |
0.22 [0.14 – 0.31] |
0.23 [0.13 – 0.31] |
1.40 [1.20 – 1.83] |
1.93 [1.33 – 3.39] |
2.19 [2.03 – 2.40] |
|
sarcoma |
0.25 [0.10 – 0.31] |
0.16 [0.11 – 0.27] |
0.21 [0.20 – 0.35] |
1.38 [0.93 – 1.53] |
2.48 [1.67 – 3.71] |
2.53 [1.78 – 2.87] |
|
lymphoma |
0.22 [0.17 – 0.25] |
0.22 [0.13 – 0.41] |
0.23 [0.16 – 0.27] |
0.92 [0.83 – 1.07][1] |
2.96 [1.74 – 4.00] |
2.12 [1.83 – 2.50] |
|
urothelial carcinoma |
0.21 [0.16 – 0.26] |
0.14 [0.11 – 0.21] |
0.19 [0.17 – 0.28] |
1.65 [1.24 – 1.85]2 |
2.44 [1.31 – 3.12] |
2.22 [2.07 – 2.46] |
|
germ cell carcinoma |
0.24 [0.19 – 0.30] |
0.15 [0.09 – 0.20] |
0.16 [0.12 – 0.22][2] |
1.32 [1.04 – 1.75] |
3.59 [2.43 – 3.69] |
2.19 [2.13 – 2.54] |
|
endometrial carcinoma |
0.15 [0.11 – 0.19] |
0.12 [0.10 – 0.14] |
0.33 [0.29 – 0.37] |
1.31 [1.15 – 1.57] |
3.19 [2.09 – 4.05] |
2.15 [2.03 – 2.42] |
|
other |
0.18 [0.17 – 0.23] |
0.19 [0.16 – 0.27] |
0.30 [0.18 – 0.40] |
1.08 [0.90 – 1.65] |
1.70 [1.32 – 2.66] |
2.29 [1.70 – 2.66] |
GI: gastrointestinal; non-normally distributed data is shown as median [interquartile range]. GI: gastrointestinal; nicht normalverteilte Daten sind dargestellt als Median [Interquartilenabstand].
1 P< 0.005.
2 P< 0.05.
Comparing lymphomas to other metastases showed significant differences for ADCcontrast (0.92 [0.83 – 1.07] vs. 1.35 [1.10 – 1.64] P = 0.001) ([Fig. 3], [4]). The optimal cut-off value for the diagnosis of lymphoma was ADCcontrast 1.08. Using this cut-off, a specificity of 98.5 % and a sensitivity of 18.4 % were achieved with a positive/negative predictive value of 18.4 %/98.5 %, respectively.

Abb. 3 Patient mit einem Lymphom. Der Kontrastmittelanreichernde Tumoranteil B zeigt niedrige ADC-Werte (A,-->).

Abb. 4 Boxplots für die ADC-Werte im kontrastmittelanreichernden Tumoranteil sowie die FA-Werte im Ödem für Lymphome, Urothelkarzinome, Keimzelltumoren im Vergleich zu anderen Subtypen von Metatasen.
Metastases of urothelial carcinoma showed significantly higher median values in ADCcontrast compared to all other metastases (1.65 [1.24 – 1.85] vs. 1.30 [1.04 – 1.59], P = 0.025). Germ cell cancer metastases compared to all other brain metastases showed significantly lower values of FANEPTR (0.16 [0.12 – 0.22] vs. 0.22 [0.17 – 0.29], P = 0.038) ([Fig. 4]).
No significant differences were found in FA and ADC values of adenocarcinoma, small cell carcinoma and squamous cell carcinoma of the lung. Slight differences were found regarding subtypes of breast cancer: Breast cancer metastases with identification of Her2neu and estrogen/progesterone hormone receptor showed lower ADC values in the contrast-enhancing tumor part compared to breast cancer metastases without identification of Her2neu and hormone receptor (1.08 vs. 1.33; P = 0.032). Differences were also observed when comparing metastases of the upper GI to metastases of the lower GI (ADCnecrosis 4.64 vs. 1.68; P = 0.012). However, only a small number of patients were analyzed in these subgroups.
In the comparison of metastases of adenocarcinoma to metastases of squamous cell carcinoma independently of the origin, no significant differences were observed for ADC and FA values.
Decision tree analysis using morphological criteria only showed that the correct diagnosis was achieved in 34.0 % of cases ([Fig. 5]). The main criteria for differentiation between histopathological subtypes using this automatic classification model were hemorrhage and the pattern of contrast enhancement.

Abb. 5 Entscheidungsbaum anhand morphologischer Kriterien.
We further performed unsupervised hierarchical clustering (using a dissimilarity matrix as input for the distance function), where some trends could be observed, but no clear clustering based on histology. Similarly, principal component analysis (PCA) of complete cases with ADC and FA values showed no separation of a set of tumors. ([Fig. 6]).

Abb. 6 Hauptkomponentenanalyse für ADC-Werte A und ADC- und FA-Werte B für verschiedene Hirnmetastasen. Clusteranalyse C.
#
Discussion
Significant differences in morphological criteria between histopathological subtypes of brain metastases and primary CNS lymphomas were observed, but due to a high variability and low specificity of these parameters, use in the clinical routine is limited. Except for lower ADC values in primary CNS lymphomas, no significant differences regarding FA/ADC values between different types of brain metastases were disclosed. Therefore, DTI is not a reliable tool for the differentiation between brain metastases. Histopathological assessment is still essential for diagnosis.
Brain metastases occur more often than gliomas and are sometimes the first manifestation of cancer [2]. MRI was shown to be superior to CT imaging for the detection of brain metastases. Pre- and post-contrast T1w sequences are mandatory for diagnosis [15] [16]. MRI is performed for staging in patients with known malignancies or in patients with neurological symptoms [1]. Imaging provides information about the location and extent of brain metastases and morphologic criteria such as hemorrhage, contact to dura, singularity and pattern of contrast enhancement. MRI is important for further therapy decisions such as surgery or radiotherapy [2]. Knowledge of the primary tumor of the metastatic brain lesion is important for therapy planning. Especially in patients with unknown malignancies, diagnosis of histopathological subtypes using MRI could help targeted staging and might eliminate the need for biopsy.
Histopathological subtypes of brain metastases display different morphologic criteria which can help in differentiation. Brain metastases of melanoma, renal cancer and lung cancer are prone to show hemorrhage as confirmed by the data of this study [1] [17]. Different histopathological subtypes of brain metastases show various patterns of contrast enhancement. In this study, most lesions had solid enhancement, while nodular enhancement was not observed in brain metastases. Solid contrast enhancement is most frequently observed in breast cancer and GI cancer metastases. Another important morphologic criterion may be contact to the dura. Especially brain metastases of GI cancer and of sarcoma showed contact to the dura in this study. However, due to the low specificity of these morphological parameters, differentiation between histopathological subtypes remains challenging. Using automatic classification by decision trees of morphological criteria, a prediction of the correct diagnosis could only be performed in 34.0 %, suggesting limited applicability in the clinical routine.
Advanced imaging techniques are increasingly important in the imaging of brain metastases especially for the differentiation from gliomas. Perfusion-weighted imaging and MR spectroscopy were shown to help in the differentiation between brain metastases and glioblastomas [18] [19] [20]. The limitation of these imaging methods is the low spatial resolution. FET-PET imaging was shown to be important in the diagnosis of brain metastases [21]. However, it also has low spatial resolution. To date, these advanced imaging methods have not been shown to differentiate between different histopathological subtypes of brain metastases.
Diffusion-weighted imaging (DWI) and diffusion tensor imaging (DTI) are important in the preoperative MR imaging of brain lesions [10]. ADC is the most common quantitative analysis of DWI and provides information on cell density [22] [23]. Fractional anisotropy is a quantitative parameter of DTI and provides information about the directionality of diffusion processes [24]. It was shown that diffusion-weighted imaging can give additional information regarding tissue composition and can therefore help in the differentiation of intracranial tumors and tumor-like conditions. [25]. Many studies have tried to assess diffusion tensor imaging and diffusion-weighted imaging for the differentiation between brain metastases and gliomas [11] [26] [27] [28]. Higher FA values were shown in the contrast-enhancing tumor part of glioblastomas compared to brain metastases, whereas no differences were observed in the NEPTR [11]. Malignant brain tumors showed reduced FA values in the non-enhancing peritumoral region. Significant differences were observed between meningiomas, metastases and high-grade gliomas [29]. This suggests that different biology of brain lesions has an effect on fractional anisotropy values. In this explorative study germ cell cancer metastases compared to all other brain metastases showed lower FA values in the non-enhancing peritumoral region, suggesting a higher invasiveness of this type of metastasis. Due to the low patient number (n = 12), the validity of these results is limited, and further studies have to be performed. There were no other significant differences in FA values in the contrast-enhancing tumor part, the necrosis and the NEPTR of the analyzed lesions, suggesting that FA is not a reliable tool for the differentiation between brain metastases.
ADC values for the differentiation between histopathological subtypes of brain metastases were assessed in a recent study but did not show significant differences [9]. Another study showed that ADC values in the contrast-enhancing tumor part correlate with the cellularity of brain metastases [30]. Primary CNS lymphomas are known to show lower ADC values in diffusion-weighted imaging [31] [32]. This is supported by our findings that lymphomas show significantly lower ADC values in the contrast-enhancing tumor part.
Despite previous information that ADC values correlate with brain metastasis cellularity, no significant differences in ADC values were found between different histopathological subtypes of brain metastases. In addition to the minimal differences for FANEPTR in germ cell cancer metastases, minimal differences were also observed in ADC values in the contrast-enhancing tumor part for urothelial carcinomas. Due to the comparison of multiple groups of brain metastases, Bonferroni correction would have to be performed to adjust the significance level which was not considered due to the explorative character of this study. However, accounting for this, differences in FA values in germ cell cancer metastases and in ADC values in urothelial carcinoma metastases would no longer reach statistical significance.
One could assume that brain metastases with similar histopathological patterns (e. g. adenocarcinoma, squamous cell carcinoma) show differences in structure and therefore also in FA and ADC values. In this study only slight differences between subgroups of brain metastases (e. g. upper/lower GI), but no significant differences between histopathological groups independently of the origin were observed. There is high variability of brain metastases between different organs, different histopathological patterns and also between the different histopathological patterns of different organs which makes classification very difficult. Furthermore, the small number of patients in the subgroups is a main limitation for statistical analysis.
In summary, MRI including morphologic criteria, diffusion-weighted imaging and diffusion tensor imaging was not able to differentiate between histopathological subtypes of brain metastases/primary CNS lymphomas in the clinical routine. Also hierarchical clustering showed limited use of FA and ADC values for discrimination between histopathological subtypes due to high variability. This analysis focused on imaging findings and thus excluded knowledge of clinical history that would improve the correct histopathological diagnosis and may be addressed in further studies.
One possible limitation of this study is the use of manually placed ROIs without fully segmenting the complete tumor regions. It is known that especially FA values show a wide heterogeneity even between white matter tracks [33] [34]. Thus, the most representative regions were manually determined by an experienced neuroradiologist in this study. It remains to be determined if this selective approach or complete segmentation of the lesion shows better results. Further data from different MR scanners with different DTI images were analyzed for this study which might introduce an unavoidable bias. To account for this in each patient the FA/ADC values of the internal capsule were measured as previously described [13]. Another limitation is the small number of patients in some histopathological tumor types (sarcoma, germ cell, endometrial, lymphoma). However, this reflects the daily routine, as these tumor entities are rare, while the most common types of brain metastases are lung and breast cancer and melanoma.
-
Significant differences in morphologic criteria were observed between histopathological subtypes of brain metastases and primary CNS lymphomas
-
However, as the most common types of metastases/CNS lymphomas showed a high variability in appearance, the positive and negative predictive values of imaging findings were low and thus the use of these parameters is limited in the clinical routine
-
DTI was not a reliable tool for differentiation between histopathological subtypes of brain metastases, except in primary CNS lymphoma showing significantly lower ADC values
-
Therefore, biopsy and surgery are still essential for diagnosis.
#
#
Disclosure
CZ has served on scientific advisory boards for Philips and Bayer Schering; serves as co-editor on the Advisory Board of Clinical Neuroradiology; has received speaker honoraria from Bayer-Schering and Philips and has received research support and investigator fees for clinical studies from Biogen Idec, Quintiles, MSD Sharp & Dome, Boehringer Ingelheim, Inventive Health Clinical UK Ltd., Advance Cor, Brainsgate, Pfizer, Bayer-Schering, Novartis, Roche, Servier, Penumbra, WCT GmbH, Syngis, SSS Internartional Clinical Research, PPD Germany GmbH, Worldwide Clinical Trials Ltd., Phenox, Covidien, Actelion, Medivation, Medtronic, Harrison Clinical Research, Concentric, Penumbra, Pharmtrace, Reverse Medical Corp., Premier Research Germany Ltd., Surpass Medical Ltd. and GlaxoSmithKline. SB, TH, JG and BM work as consultants for Brainlab (Brainlab AG, Feldkirchen). All named potential conflicts of interest are unrelated to this study.
-
References
- 1 Fink KR, Fink JR. Imaging of brain metastases. Surgical neurology international 2013; 4: S209-S219
- 2 Soffietti R, Cornu P, Delattre JY et al. EFNS Guidelines on diagnosis and treatment of brain metastases: report of an EFNS Task Force. European journal of neurology: the official journal of the European Federation of Neurological Societies 2006; 13: 674-681
- 3 Haryu S, Saito A, Inoue M et al. Brain metastasis from invasive thymoma mimicking intracerebral hemorrhage: case report. Neurologia medico-chirurgica 2014; 54: 673-676
- 4 Terada T, Maruo H. Unusual extrahepatic metastatic sites from hepatocellular carcinoma. International journal of clinical and experimental pathology 2013; 6: 816-820
- 5 Kurra V, Krajewski KM, Jagannathan J et al. Typical and atypical metastatic sites of recurrent endometrial carcinoma. Cancer imaging: the official publication of the International Cancer Imaging Society 2013; 13: 113-122
- 6 Chiang IC, Kuo YT, Lu CY et al. Distinction between high-grade gliomas and solitary metastases using peritumoral 3-T magnetic resonance spectroscopy, diffusion, and perfusion imagings. Neuroradiology 2004; 46: 619-627
- 7 Lee EJ, terBrugge K, Mikulis D et al. Diagnostic value of peritumoral minimum apparent diffusion coefficient for differentiation of glioblastoma multiforme from solitary metastatic lesions. Am J Roentgenol 2011; 196: 71-76
- 8 Kickingereder P, Wiestler B, Sahm F et al. Primary central nervous system lymphoma and atypical glioblastoma: multiparametric differentiation by using diffusion-, perfusion-, and susceptibility-weighted MR imaging. Radiology 2014; 272: 843-850
- 9 Duygulu G, Ovali GY, Calli C et al. Intracerebral metastasis showing restricted diffusion: correlation with histopathologic findings. European journal of radiology 2010; 74: 117-120
- 10 Potgieser AR, Wagemakers M, van Hulzen AL et al. The role of diffusion tensor imaging in brain tumor surgery: a review of the literature. Clinical neurology and neurosurgery 2014; 124: 51-58
- 11 Wang S, Kim SJ, Poptani H et al. Diagnostic utility of diffusion tensor imaging in differentiating glioblastomas from brain metastases. AJNR Am J Neuroradiol 2014; 35: 928-934
- 12 General Assembly of the World Medical A. World Medical Association Declaration of Helsinki: ethical principles for medical research involving human subjects. The Journal of the American College of Dentists 2014; 81: 14-18
- 13 Tan WL, Huang WY, Yin B et al. Can diffusion tensor imaging noninvasively detect IDH1 gene mutations in astrogliomas? A retrospective study of 112 cases. AJNR Am J Neuroradiol 2014; 35: 920-927
- 14 Gaujoux R, Seoighe C. A flexible R package for nonnegative matrix factorization. BMC bioinformatics 2010; 11: 367
- 15 Kakeda S, Korogi Y, Hiai Y et al. Detection of brain metastasis at 3T: comparison among SE, IR-FSE and 3D-GRE sequences. Eur Radiol 2007; 17: 2345-2351
- 16 Komada T, Naganawa S, Ogawa H et al. Contrast-enhanced MR imaging of metastatic brain tumor at 3 tesla: utility of T(1)-weighted SPACE compared with 2D spin echo and 3D gradient echo sequence. Magnetic resonance in medical sciences: MRMS: an official journal of Japan Society of Magnetic Resonance in Medicine 2008; 7: 13-21
- 17 Radbruch A, Graf M, Kramp L et al. Differentiation of brain metastases by percentagewise quantification of intratumoral-susceptibility-signals at 3Tesla. European journal of radiology 2012; 81: 4064-4068
- 18 Bauer AH, Erly W, Moser FG et al. Differentiation of solitary brain metastasis from glioblastoma multiforme: a predictive multiparametric approach using combined MR diffusion and perfusion. Neuroradiology 2015; 57: 697-703
- 19 Crisi G, Orsingher L, Filice S. Lipid and macromolecules quantitation in differentiating glioblastoma from solitary metastasis: a short-echo time single-voxel magnetic resonance spectroscopy study at 3 T. Journal of computer assisted tomography 2013; 37: 265-271
- 20 Halshtok Neiman O, Sadetzki S, Chetrit A et al. Perfusion-weighted imaging of peritumoral edema can aid in the differential diagnosis of glioblastoma mulltiforme versus brain metastasis. The Israel Medical Association journal: IMAJ 2013; 15: 103-105
- 21 Gempt J, Bette S, Buchmann N et al. Volumetric Analysis of F-18-FET-PET Imaging for Brain Metastases. World neurosurgery 2015; DOI: 10.1016/j.wneu.2015.07.067.
- 22 Guo AC, Cummings TJ, Dash RC et al. Lymphomas and high-grade astrocytomas: comparison of water diffusibility and histologic characteristics. Radiology 2002; 224: 177-183
- 23 Shim WH, Kim HS, Choi CG et al. Comparison of Apparent Diffusion Coefficient and Intravoxel Incoherent Motion for Differentiating among Glioblastoma, Metastasis, and Lymphoma Focusing on Diffusion-Related Parameter. PloS one 2015; 10: e0134761
- 24 Basser PJ, Pierpaoli C. Microstructural and physiological features of tissues elucidated by quantitative-diffusion-tensor MRI. J Magn Reson B 1996; 111: 209-219
- 25 Okamoto K, Ito J, Ishikawa K et al. Diffusion-weighted echo-planar MR imaging in differential diagnosis of brain tumors and tumor-like conditions. Eur Radiol 2000; 10: 1342-1350
- 26 Byrnes TJ, Barrick TR, Bell BA et al. Diffusion tensor imaging discriminates between glioblastoma and cerebral metastases in vivo. NMR Biomed 2011; 24: 54-60
- 27 Lu S, Ahn D, Johnson G et al. Peritumoral diffusion tensor imaging of high-grade gliomas and metastatic brain tumors. AJNR Am J Neuroradiol 2003; 24: 937-941
- 28 Tsougos I, Svolos P, Kousi E et al. Differentiation of glioblastoma multiforme from metastatic brain tumor using proton magnetic resonance spectroscopy, diffusion and perfusion metrics at 3 T. Cancer imaging: the official publication of the International Cancer Imaging Society 2012; 12: 423-436
- 29 Lu S, Ahn D, Johnson G et al. Diffusion-tensor MR imaging of intracranial neoplasia and associated peritumoral edema: introduction of the tumor infiltration index. Radiology 2004; 232: 221-228
- 30 Hayashida Y, Hirai T, Morishita S et al. Diffusion-weighted imaging of metastatic brain tumors: comparison with histologic type and tumor cellularity. AJNR Am J Neuroradiol 2006; 27: 1419-1425
- 31 Mabray MC, Barajas RF, Villanueva-Meyer JE et al. The Combined Performance of ADC, CSF CXC Chemokine Ligand 13, and CSF Interleukin 10 in the Diagnosis of Central Nervous System Lymphoma. AJNR Am J Neuroradiol 2016; 37: 74-79
- 32 Zacharia TT, Law M, Naidich TP et al. Central nervous system lymphoma characterization by diffusion-weighted imaging and MR spectroscopy. Journal of neuroimaging: official journal of the American Society of Neuroimaging 2008; 18: 411-417
- 33 Kang X, Herron TJ, Woods DL. Regional variation, hemispheric asymmetries and gender differences in pericortical white matter. Neuroimage 2011; 56: 2011-2023
- 34 Wakana S, Caprihan A, Panzenboeck MM et al. Reproducibility of quantitative tractography methods applied to cerebral white matter. Neuroimage 2007; 36: 630-644
Correspondence
-
References
- 1 Fink KR, Fink JR. Imaging of brain metastases. Surgical neurology international 2013; 4: S209-S219
- 2 Soffietti R, Cornu P, Delattre JY et al. EFNS Guidelines on diagnosis and treatment of brain metastases: report of an EFNS Task Force. European journal of neurology: the official journal of the European Federation of Neurological Societies 2006; 13: 674-681
- 3 Haryu S, Saito A, Inoue M et al. Brain metastasis from invasive thymoma mimicking intracerebral hemorrhage: case report. Neurologia medico-chirurgica 2014; 54: 673-676
- 4 Terada T, Maruo H. Unusual extrahepatic metastatic sites from hepatocellular carcinoma. International journal of clinical and experimental pathology 2013; 6: 816-820
- 5 Kurra V, Krajewski KM, Jagannathan J et al. Typical and atypical metastatic sites of recurrent endometrial carcinoma. Cancer imaging: the official publication of the International Cancer Imaging Society 2013; 13: 113-122
- 6 Chiang IC, Kuo YT, Lu CY et al. Distinction between high-grade gliomas and solitary metastases using peritumoral 3-T magnetic resonance spectroscopy, diffusion, and perfusion imagings. Neuroradiology 2004; 46: 619-627
- 7 Lee EJ, terBrugge K, Mikulis D et al. Diagnostic value of peritumoral minimum apparent diffusion coefficient for differentiation of glioblastoma multiforme from solitary metastatic lesions. Am J Roentgenol 2011; 196: 71-76
- 8 Kickingereder P, Wiestler B, Sahm F et al. Primary central nervous system lymphoma and atypical glioblastoma: multiparametric differentiation by using diffusion-, perfusion-, and susceptibility-weighted MR imaging. Radiology 2014; 272: 843-850
- 9 Duygulu G, Ovali GY, Calli C et al. Intracerebral metastasis showing restricted diffusion: correlation with histopathologic findings. European journal of radiology 2010; 74: 117-120
- 10 Potgieser AR, Wagemakers M, van Hulzen AL et al. The role of diffusion tensor imaging in brain tumor surgery: a review of the literature. Clinical neurology and neurosurgery 2014; 124: 51-58
- 11 Wang S, Kim SJ, Poptani H et al. Diagnostic utility of diffusion tensor imaging in differentiating glioblastomas from brain metastases. AJNR Am J Neuroradiol 2014; 35: 928-934
- 12 General Assembly of the World Medical A. World Medical Association Declaration of Helsinki: ethical principles for medical research involving human subjects. The Journal of the American College of Dentists 2014; 81: 14-18
- 13 Tan WL, Huang WY, Yin B et al. Can diffusion tensor imaging noninvasively detect IDH1 gene mutations in astrogliomas? A retrospective study of 112 cases. AJNR Am J Neuroradiol 2014; 35: 920-927
- 14 Gaujoux R, Seoighe C. A flexible R package for nonnegative matrix factorization. BMC bioinformatics 2010; 11: 367
- 15 Kakeda S, Korogi Y, Hiai Y et al. Detection of brain metastasis at 3T: comparison among SE, IR-FSE and 3D-GRE sequences. Eur Radiol 2007; 17: 2345-2351
- 16 Komada T, Naganawa S, Ogawa H et al. Contrast-enhanced MR imaging of metastatic brain tumor at 3 tesla: utility of T(1)-weighted SPACE compared with 2D spin echo and 3D gradient echo sequence. Magnetic resonance in medical sciences: MRMS: an official journal of Japan Society of Magnetic Resonance in Medicine 2008; 7: 13-21
- 17 Radbruch A, Graf M, Kramp L et al. Differentiation of brain metastases by percentagewise quantification of intratumoral-susceptibility-signals at 3Tesla. European journal of radiology 2012; 81: 4064-4068
- 18 Bauer AH, Erly W, Moser FG et al. Differentiation of solitary brain metastasis from glioblastoma multiforme: a predictive multiparametric approach using combined MR diffusion and perfusion. Neuroradiology 2015; 57: 697-703
- 19 Crisi G, Orsingher L, Filice S. Lipid and macromolecules quantitation in differentiating glioblastoma from solitary metastasis: a short-echo time single-voxel magnetic resonance spectroscopy study at 3 T. Journal of computer assisted tomography 2013; 37: 265-271
- 20 Halshtok Neiman O, Sadetzki S, Chetrit A et al. Perfusion-weighted imaging of peritumoral edema can aid in the differential diagnosis of glioblastoma mulltiforme versus brain metastasis. The Israel Medical Association journal: IMAJ 2013; 15: 103-105
- 21 Gempt J, Bette S, Buchmann N et al. Volumetric Analysis of F-18-FET-PET Imaging for Brain Metastases. World neurosurgery 2015; DOI: 10.1016/j.wneu.2015.07.067.
- 22 Guo AC, Cummings TJ, Dash RC et al. Lymphomas and high-grade astrocytomas: comparison of water diffusibility and histologic characteristics. Radiology 2002; 224: 177-183
- 23 Shim WH, Kim HS, Choi CG et al. Comparison of Apparent Diffusion Coefficient and Intravoxel Incoherent Motion for Differentiating among Glioblastoma, Metastasis, and Lymphoma Focusing on Diffusion-Related Parameter. PloS one 2015; 10: e0134761
- 24 Basser PJ, Pierpaoli C. Microstructural and physiological features of tissues elucidated by quantitative-diffusion-tensor MRI. J Magn Reson B 1996; 111: 209-219
- 25 Okamoto K, Ito J, Ishikawa K et al. Diffusion-weighted echo-planar MR imaging in differential diagnosis of brain tumors and tumor-like conditions. Eur Radiol 2000; 10: 1342-1350
- 26 Byrnes TJ, Barrick TR, Bell BA et al. Diffusion tensor imaging discriminates between glioblastoma and cerebral metastases in vivo. NMR Biomed 2011; 24: 54-60
- 27 Lu S, Ahn D, Johnson G et al. Peritumoral diffusion tensor imaging of high-grade gliomas and metastatic brain tumors. AJNR Am J Neuroradiol 2003; 24: 937-941
- 28 Tsougos I, Svolos P, Kousi E et al. Differentiation of glioblastoma multiforme from metastatic brain tumor using proton magnetic resonance spectroscopy, diffusion and perfusion metrics at 3 T. Cancer imaging: the official publication of the International Cancer Imaging Society 2012; 12: 423-436
- 29 Lu S, Ahn D, Johnson G et al. Diffusion-tensor MR imaging of intracranial neoplasia and associated peritumoral edema: introduction of the tumor infiltration index. Radiology 2004; 232: 221-228
- 30 Hayashida Y, Hirai T, Morishita S et al. Diffusion-weighted imaging of metastatic brain tumors: comparison with histologic type and tumor cellularity. AJNR Am J Neuroradiol 2006; 27: 1419-1425
- 31 Mabray MC, Barajas RF, Villanueva-Meyer JE et al. The Combined Performance of ADC, CSF CXC Chemokine Ligand 13, and CSF Interleukin 10 in the Diagnosis of Central Nervous System Lymphoma. AJNR Am J Neuroradiol 2016; 37: 74-79
- 32 Zacharia TT, Law M, Naidich TP et al. Central nervous system lymphoma characterization by diffusion-weighted imaging and MR spectroscopy. Journal of neuroimaging: official journal of the American Society of Neuroimaging 2008; 18: 411-417
- 33 Kang X, Herron TJ, Woods DL. Regional variation, hemispheric asymmetries and gender differences in pericortical white matter. Neuroimage 2011; 56: 2011-2023
- 34 Wakana S, Caprihan A, Panzenboeck MM et al. Reproducibility of quantitative tractography methods applied to cerebral white matter. Neuroimage 2007; 36: 630-644
Abb. 1 Die erste Reihe zeigt eine Melanommetastase mit einem hyperintensen Signal in der nativen T1-Sequenz A und einer zirkulären Kontrastmittelanreicherung B. Die zweite Reihe zeigt ein Beispiel einer Nierenzellkarzinommetastase mit einer Einblutung C und einer zirkulären Kontrastmittelanreicherung D. Beispiel einer Metastase eines gastrointestinalen Karzinoms mit einem typischen Kontakt zur Dura E. Typische solide Kontrastmittelanreicherung einer Mammakarzinommetastase F.
Abb. 2 Werte für ADCcontrast in den unterschiedlichen histopathologischen Subtypen von Hirnmetastasen. * P< 0,05.
Abb. 3 Patient mit einem Lymphom. Der Kontrastmittelanreichernde Tumoranteil B zeigt niedrige ADC-Werte (A,-->).
Abb. 4 Boxplots für die ADC-Werte im kontrastmittelanreichernden Tumoranteil sowie die FA-Werte im Ödem für Lymphome, Urothelkarzinome, Keimzelltumoren im Vergleich zu anderen Subtypen von Metatasen.
Abb. 5 Entscheidungsbaum anhand morphologischer Kriterien.
Abb. 6 Hauptkomponentenanalyse für ADC-Werte A und ADC- und FA-Werte B für verschiedene Hirnmetastasen. Clusteranalyse C.